
 Record cold and record warm temperatures across the planet can cause major and widespread impacts to life and property. But how frequent are these extreme temperature events? How do the frequencies of record warm events and record cold events compare, and have their relative frequencies changed over time? A new product, funded by the NOAA Climate Program Office’s Climate Observations and Monitoring Program, provides historical perspectives on occurrences of record warm and record cold average monthly temperatures across the globe from 1951 to the present. It is now part of the NOAA National Centers for Environmental Information’s (NCEI) regular climate monitoring activities as a fully automated product. “The new product allows NOAA to better articulate indicators and impacts of climate change in a manner that is readily accessible by the public and decision makers,” said Anthony Arguez, Physical Scientist with NCEI and lead researcher for the product. With the graphics available as part of this product, decision makers and the public can see how a single record warm or cold event fits within the bigger climate picture. Without historical context, a record cold spell like the late January 2019 event that impacted the Midwest, for example, can lead some to question the validity of observed climate change. However, a cold event may be just a blip in the long-term trend or cover only a small fraction of the Earth, occurring while other areas experience warmer than normal temperatures. Each month, users will now see graphs showing how much of the Earth’s surface experienced record warm or record cold average temperatures, and how those percentages have changed over time. They will also see how the ratio of warm records to cold records has changed over the years on a monthly, seasonal, or annual basis. “This product will help users better understand how the impacts of climate change are felt in terms of record temperatures,” said Arguez. “For example, we can communicate that cold records will still occur, but they are likely to be much less common than warm records. This will help correct the misconception that the occurrence of cold records implies that the global climate is not warming.” The latest release of the product showed that for the month of September there have been more areas experiencing warm records than cold records every year since 1997.
 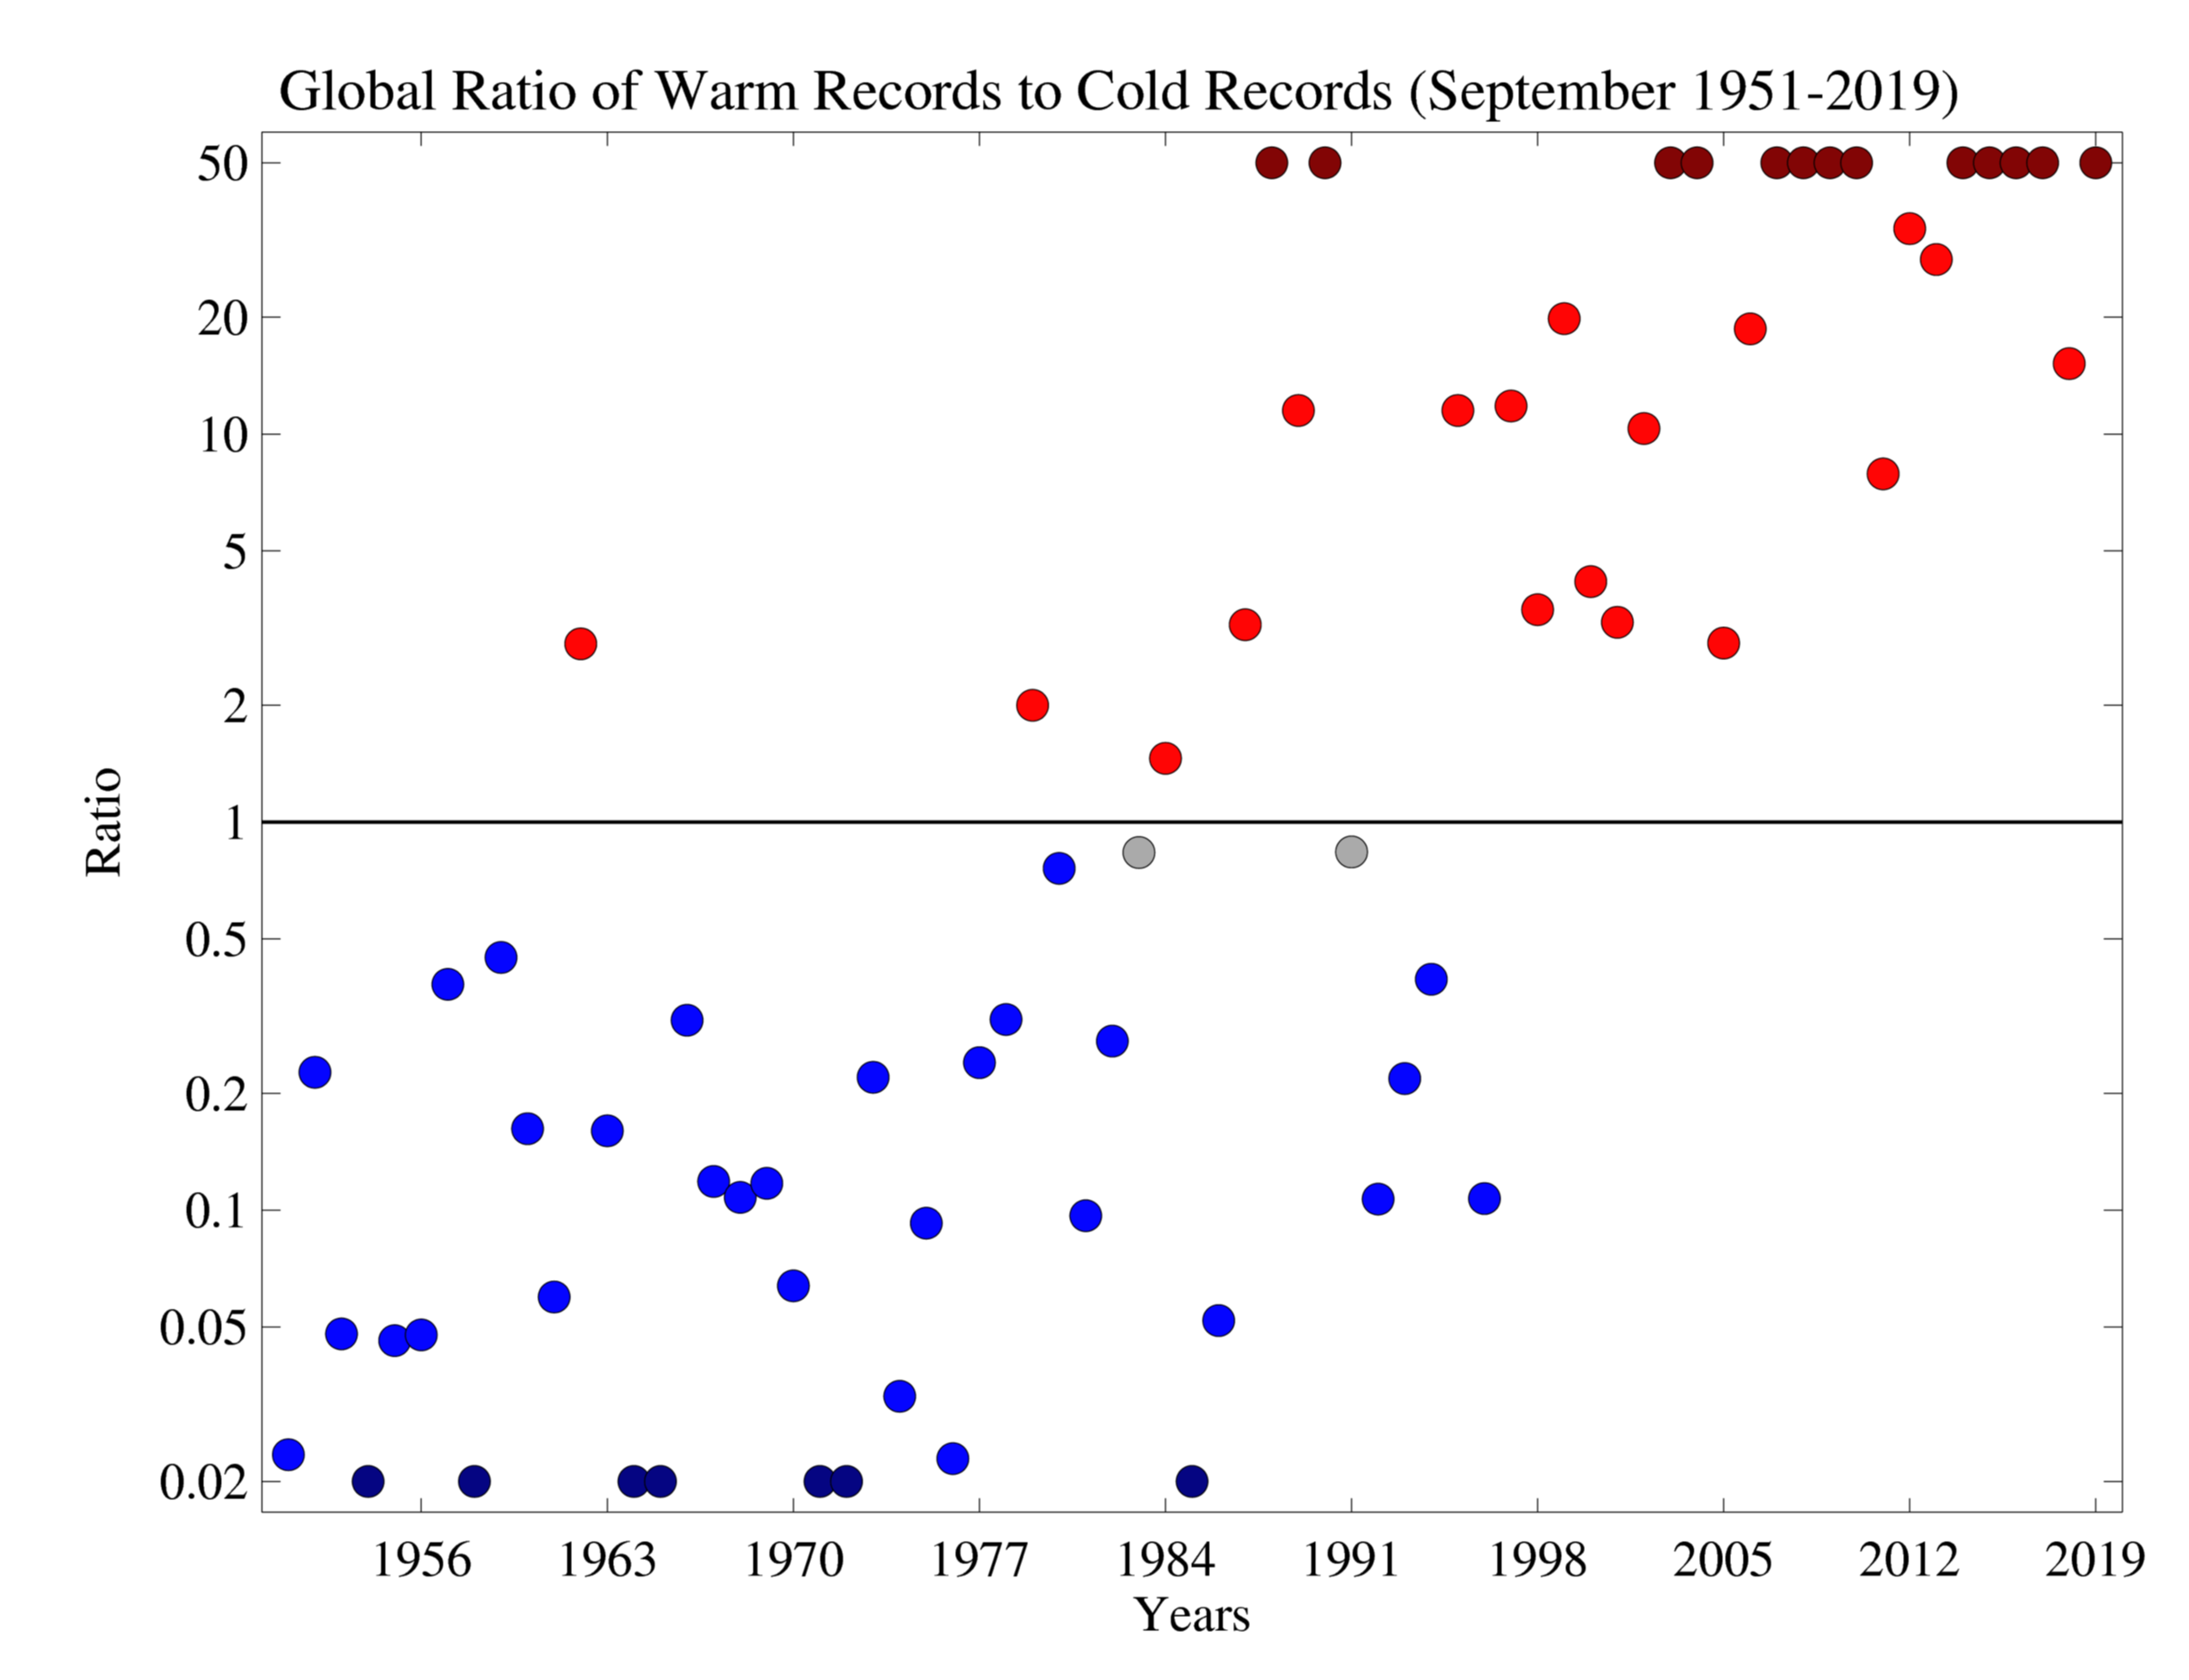 Time series of the ratio of warm records to cold records for September from 1951-2019. A value of 50, for example, indicates that the global area experiencing record warm mean monthly temperatures was 50 times as big as the global area experiencing record cold conditions. Ratio values between 0.8 (four to five) and 1.25 (five to four) are shown in gray. Red circles indicate values above 1.25. Blue circles indicate values below 0.8. Dark red values represent either a ratio value that is greater than 50 or an observation in which the warm record area is non-zero and the cold record area is zero. Dark blue values represent either a ratio value that is less than 0.02 or an observation in which the cold record area is non-zero and the warm record area is zero. It also showed that, during September 2019, 7.93% of the world’s land and ocean surfaces had a record warm month, while no land or ocean areas experienced record cold temperatures. “This was the second highest percentage for any record warm September temperature across the globe since 1951,” added Arguez.
 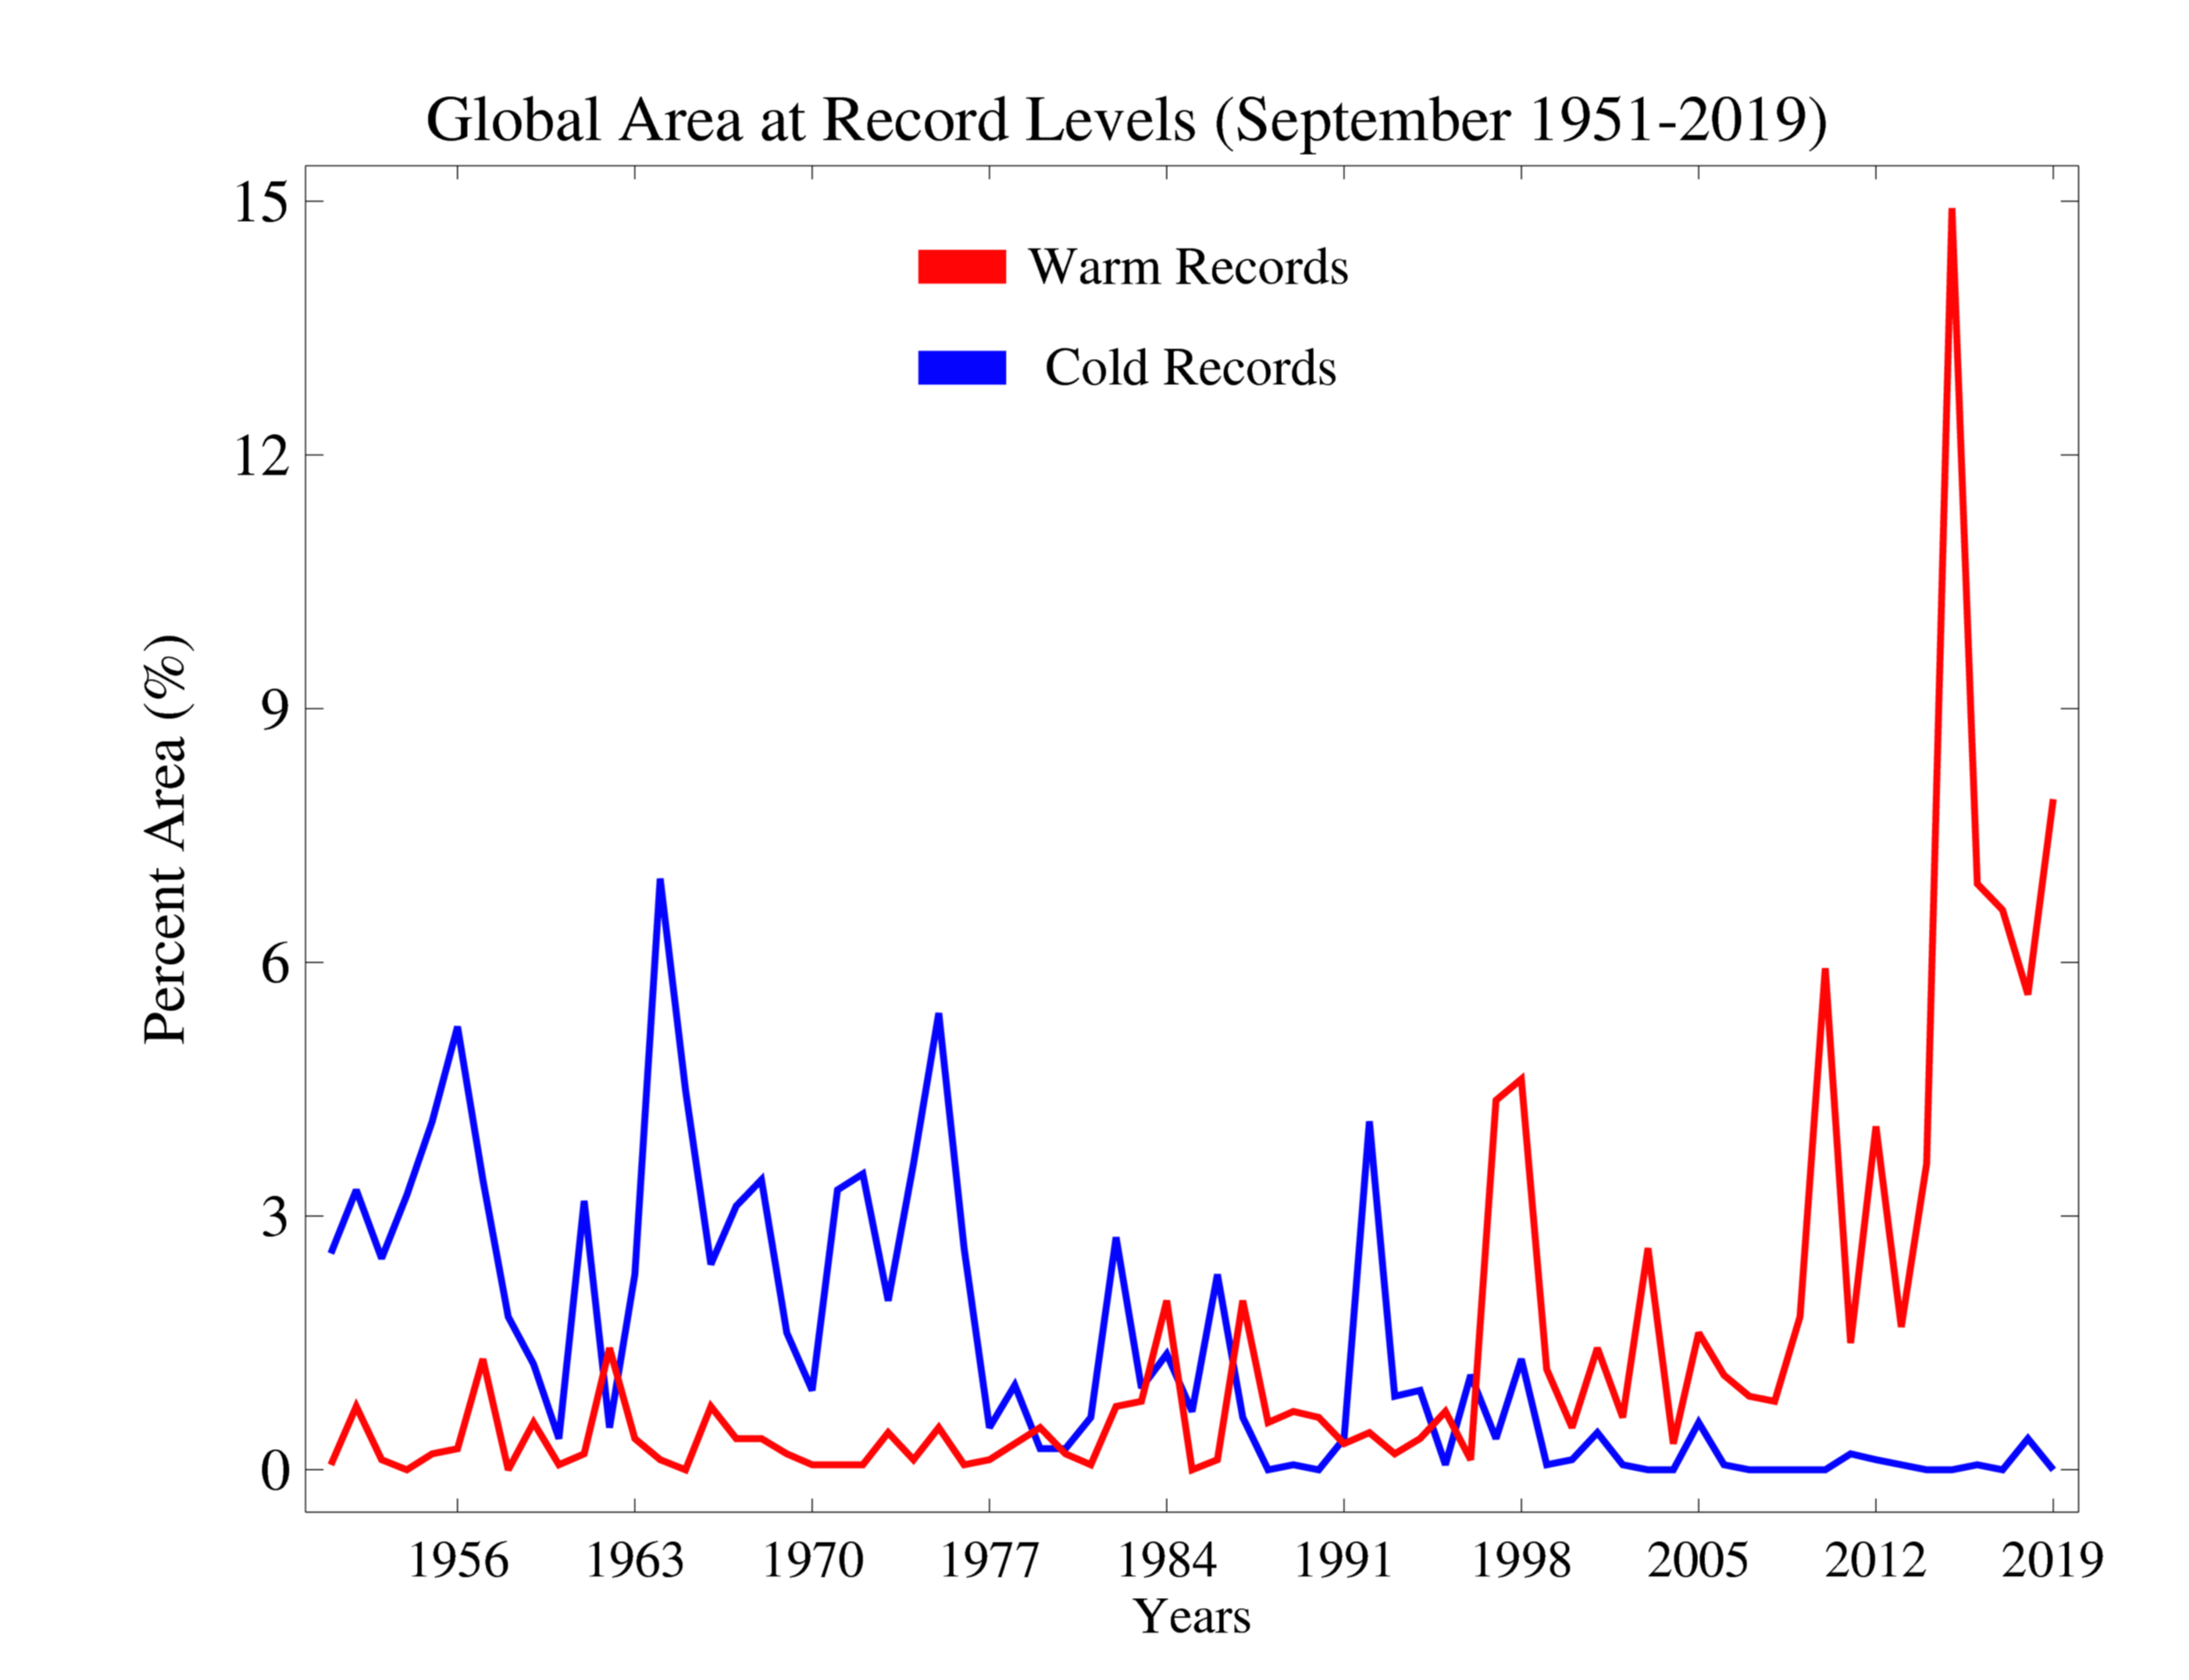 Time series of global land and ocean areas at record cold and warm temperatures for September from 1951-2019. With each monthly release, users will also be able to see the product on different spatial scales (e.g. hemispheres, land-only, ocean-only, land and ocean) and time scales (months, seasons, and years). According to Arguez, these different aggregations show us that, no matter how you slice it, record cold conditions are still occurring, but considerably less often than record warm conditions.


")


