


Extreme heat kills more Americans than any other weather event, but not everyone’s risk is the same. Within the same city, some neighborhoods can be up to 20°F hotter than others and, due largely to the practice of historic redlining—discriminatory, race-based lending and housing policies in the 1930s— these hot spots are often home to poorer communities of color.
To learn where action is needed to protect vulnerable populations now and in the future, CPO’s National Integrated Heat Health Information System (NIHHIS) and partners are launching new community-led campaigns that will map the hottest parts of cities in 11 states across the country this summer. The communities include Albuquerque, New Mexico; Atlanta; New York City; Charleston, South Carolina; Kansas City, Missouri; Raleigh & Durham, North Carolina; San Diego; San Francisco; and parts of New Jersey, Indiana, Massachusetts, and Virginia.
“Our Nation faces a growing climate crisis that has exacerbated inequities, particularly for the low-income and communities of color,” said U.S. Secretary of Commerce Gina M. Raimondo. “The Biden-Harris Administration is ready to take swift action to tackle climate change, and we at the Department of Commerce are so pleased to be partnering with communities around the country toward equitable climate resilience by working with them to design safer, more livable, and healthier cities.”
The mapping campaigns are part of a collaborative project with CAPA Strategies, LLC and local partners that has empowered many other U.S. communities to map heat in their cities over the past four years. This summer’s new campaigns will cover neighborhoods on both coasts and across America’s heartland.
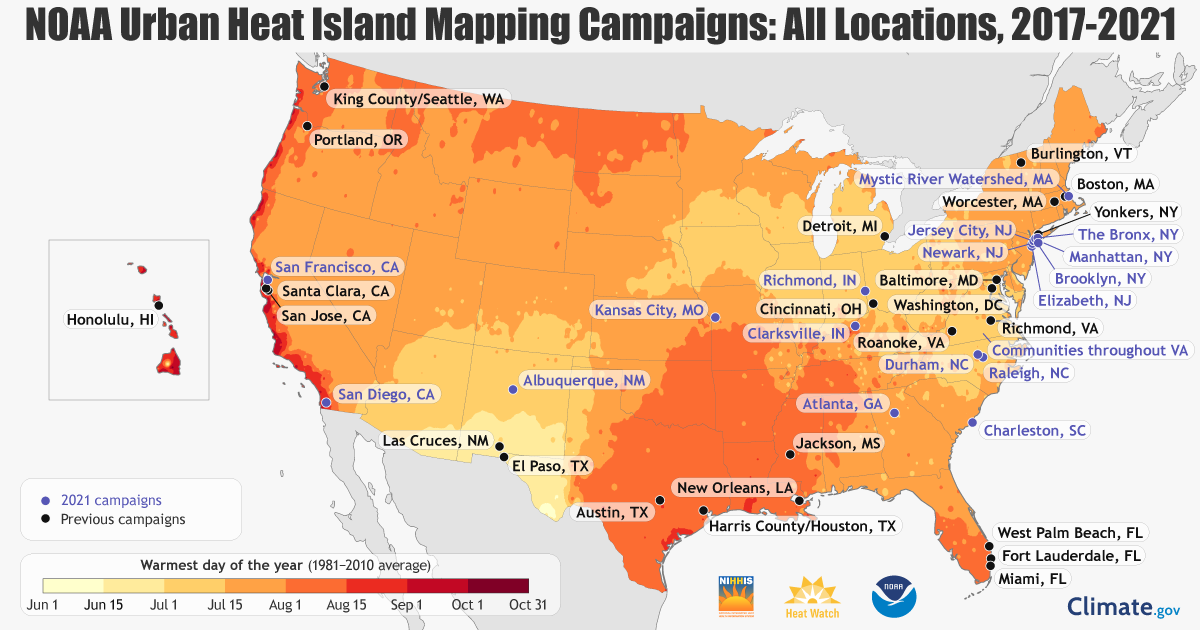
This map shows the locations of the 2021 urban heat island mapping campaigns cohort and previous campaign locations. NOAA is funding nine of the 2021 campaigns and partnering with four that have secured independent funding. The background shows the average window for the day of the year with the highest maximum temperature based on the 1981-2010 U.S. Climate Normals, the nation’s official record of recent climate. The colors show date ranges progressing from June 1 (lightest yellow) through September 30 (darkest red). The darker the color, the later in the year the hottest day typically arrives. Credit: Climate.gov using data from NOAA NCEI
Local maps for local solutions
Using heat sensors mounted on their own cars or bikes, community volunteers, led by a team of local partners in each city, will traverse their neighborhoods morning, afternoon, and evening on one of the hottest days of the year. The sensors will record temperature, humidity, time, and the volunteers’ location every second. NOAA’s National Weather Service will provide forecasts to help the communities plan their campaigns.
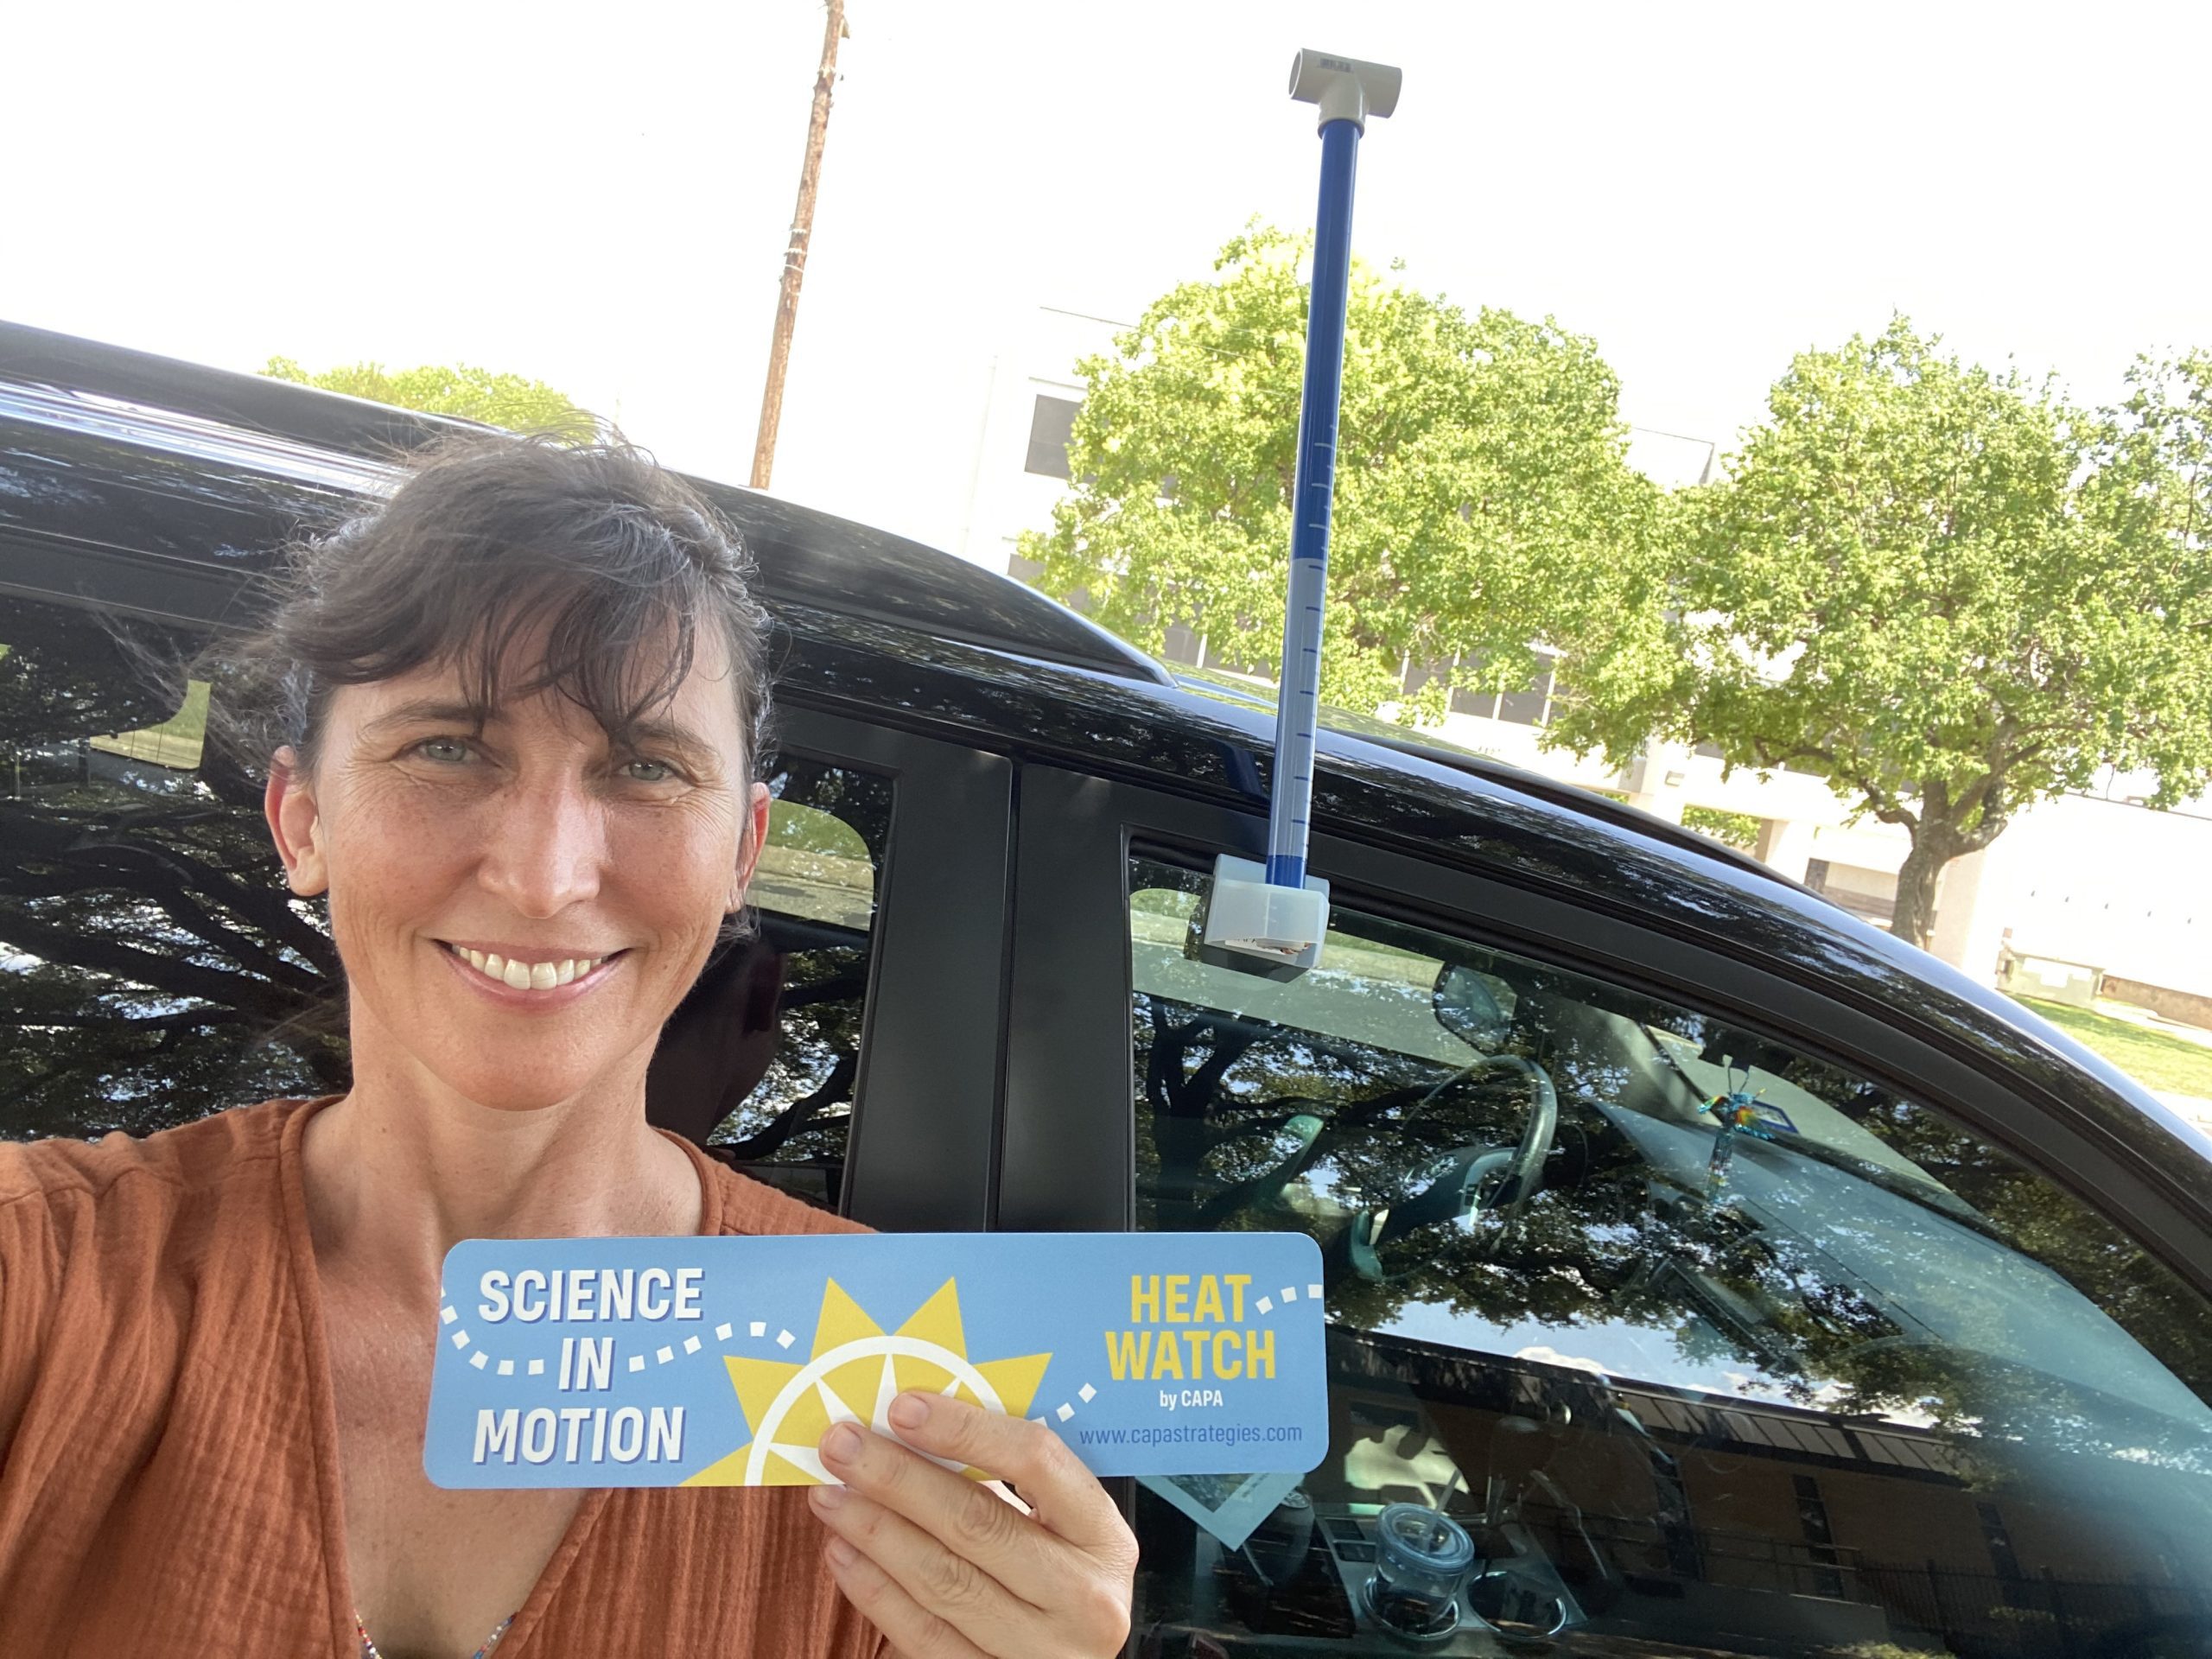
April Rose from the City of Austin’s Forestry Division was part of the volunteer team that collected temperature data in the Austin, Texas area last summer to help produce urban heat maps for the community. Credit: City of Austin
By working with communities, the campaigns will raise awareness among volunteers and residents about heat risk, incorporate local perspectives to produce heat maps, and engage communities in pursuing solutions.
Cities from past campaigns have used the heat maps to inform heat-mitigation decisions, educate residents and policymakers, and direct research on effective solutions. The city of Houston, Texas incorporated the mapping results into its Climate Action Plan. The city of Richmond, Virginia used data from the heat island campaign to turn city-owned land into new community green spaces.
“Communities are taking action to manage dangerous extreme heat that’s impacting their families and neighbors,” said Hunter Jones, Climate and Health Project Manager with NOAA’s Climate Program Office. “As climate change brings worsening heat waves, the information from these campaigns will help bring local and equitable solutions to those facing the greatest threat.”
Addressing an unequal heat risk
On top of climate change, cityscapes worsen extreme heat’s heavy toll. Known as the “urban heat island effect,” paved, dark surfaces, like roads and buildings, absorb and radiate more heat than natural landscapes with trees and grass, driving up local temperatures.
According to a recent nationwide study spurred by past NOAA and partner heat island campaign efforts, neighborhoods subjected to historical redlining typically lack green space and suffer most from urban heat islands. The study found that 94% of formerly redlined areas, which remain mostly lower income communities of color, are exposed to higher temperatures than non-redlined, affluent areas.
“The mapping campaigns provide a roadmap to help communities alleviate these disparities by identifying specific locations where heat-mitigating interventions could save lives,” said Vivek Shandas, study co-author and Portland State University Climate Adaptation Professor.
To keep up with the summer 2021 campaigns, subscribe to the Heat Beat Newsletter, check out the National Integrated Heat Health Information System website, or follow #UrbanHeatMaps2021on social media.
Go online for more information on health resources for extreme heat and access urban heat mapping data from past campaigns.
The urban heat island mapping campaign is supported by NOAA’s Climate Program Office (CPO) through its National Integrated Heat Health Information System (NIHHIS) — a NOAA and Centers for Disease Control and Prevention effort — and Communication, Education, and Engagement Division. NIHHIS is funding, in part, nine campaigns and partnering with four that have secured independent funding. The campaigns are jointly coordinated by NIHHIS and CAPA Strategies LLC.


")


