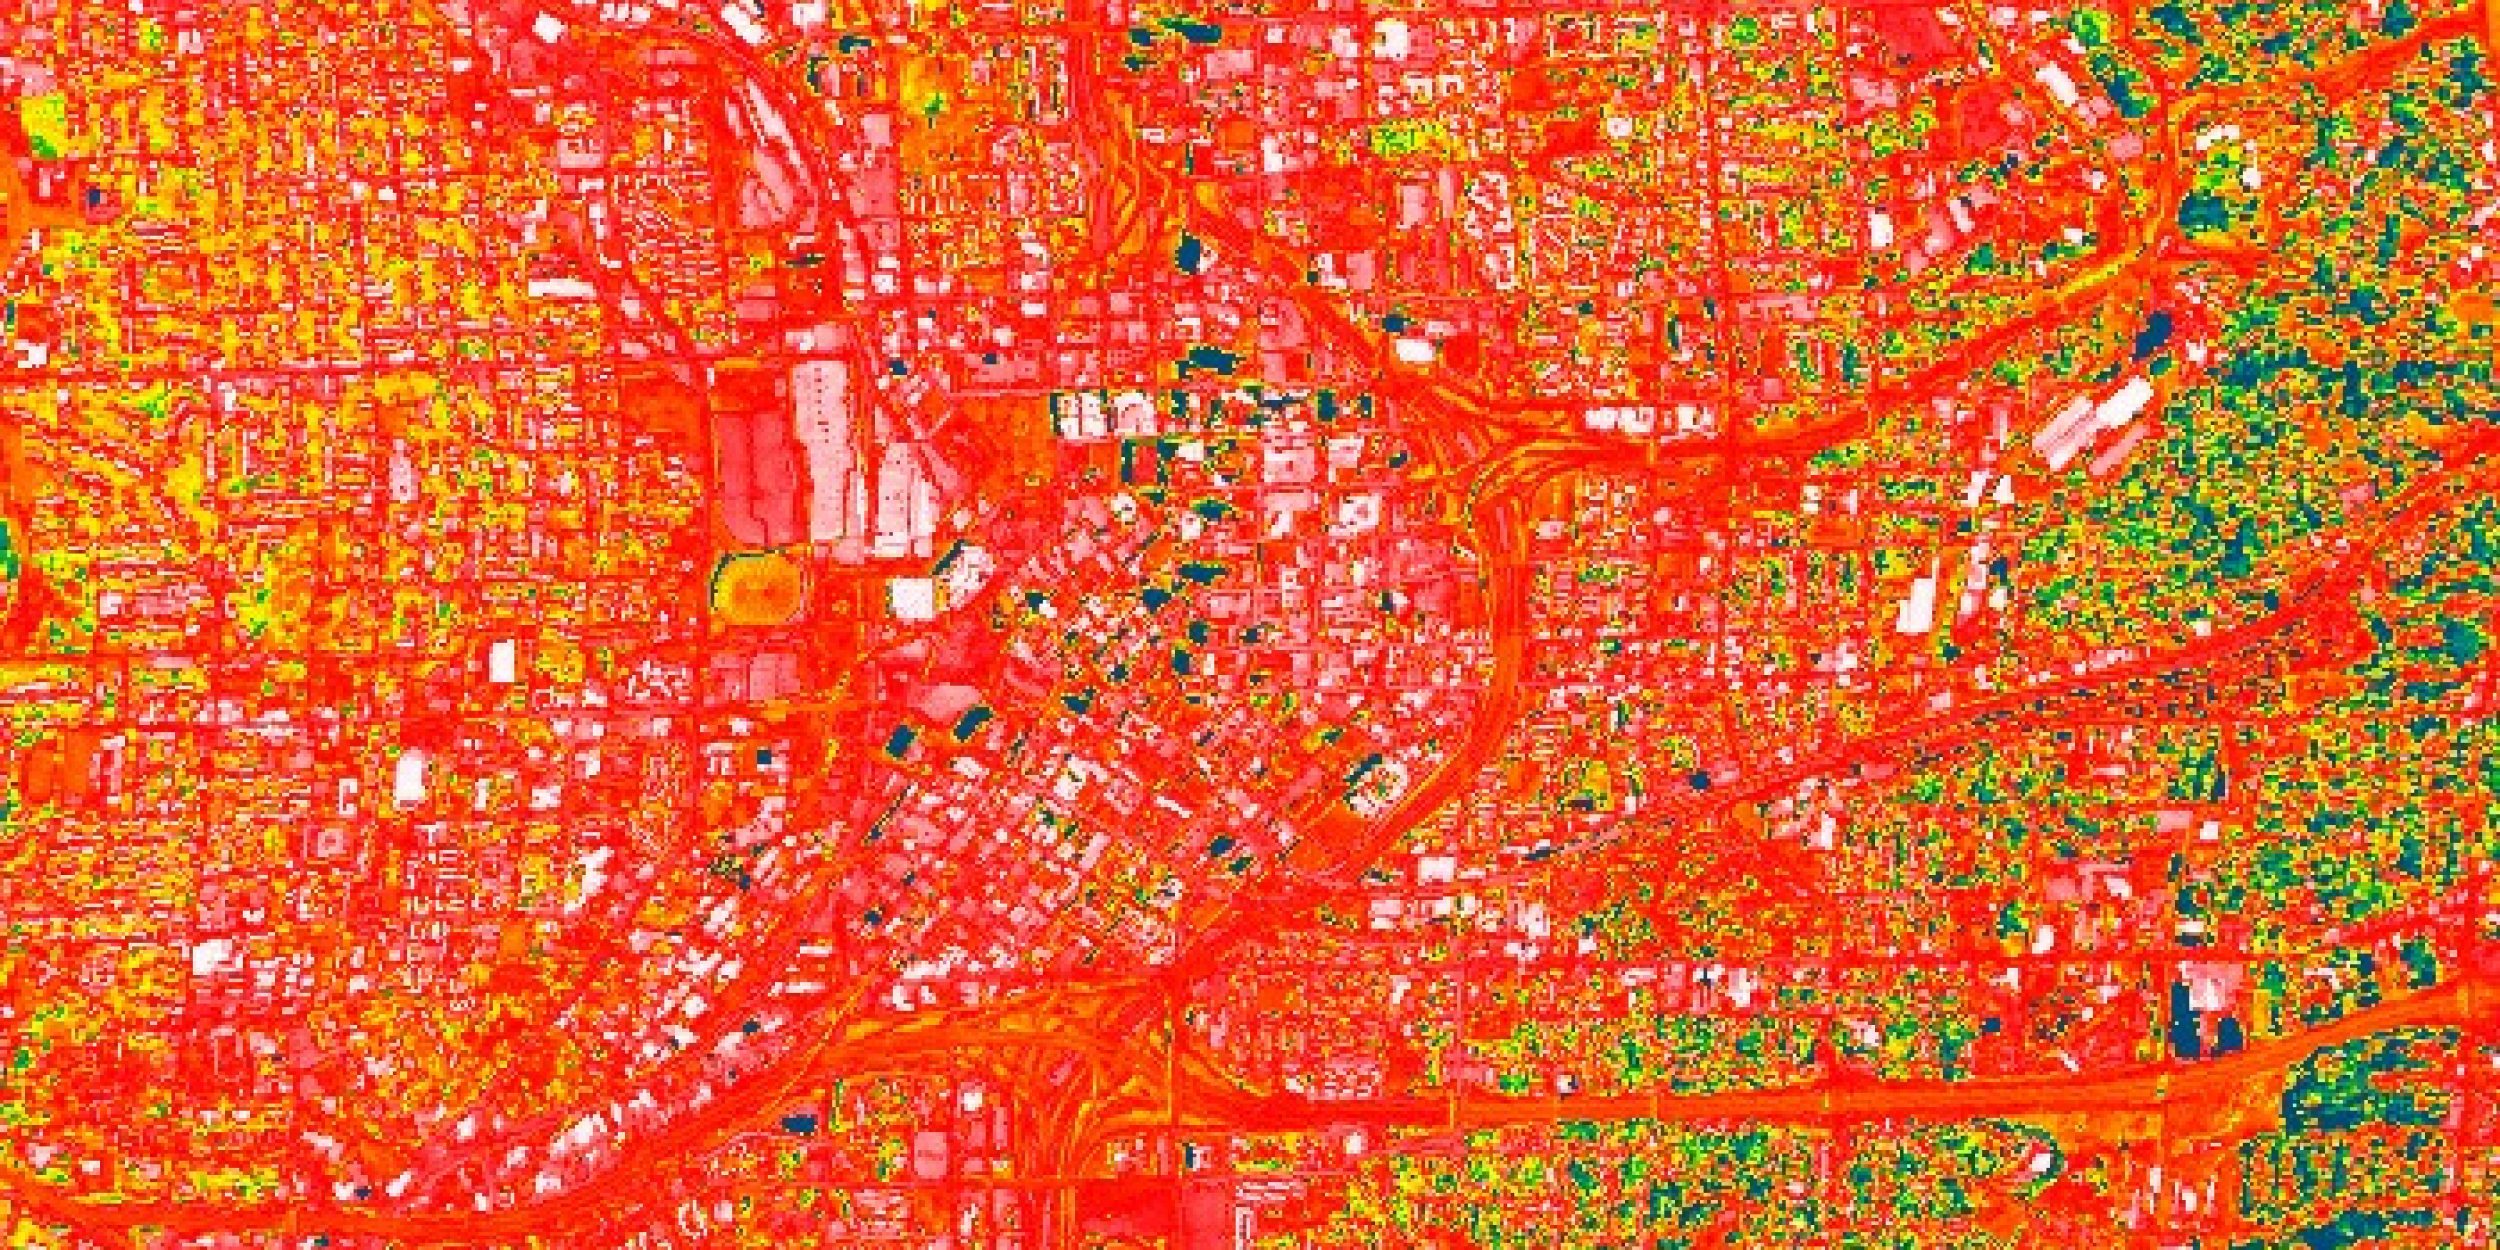

Satellite imagery of urban Atlanta shows the differences in daytime heating, as caused by the urban heat island effect. Surface temperatures range from 50 (blue) to 120+ degrees (white) Fahrenheit. Credit: NASA Goddard’s Scientific Visualization Studio
The NOAA CPO Modeling, Analysis, Predictions, and Projections (MAPP) program will host a webinar on the topic of Extreme Heat and Health: Creating Environmental Intelligence Through Science, Predictions, and Engagement on Thursday, April 28, 2016. The announcement is provided below.


| Date/Time | Title |
| April 28, 2016 4:00 PM – 5:30 PM ET |
Extreme Heat and Health: Creating Environmental Intelligence Through Science, Predictions, and Engagement |
| Speakers and Topics: | Andrew Marshall (Australian Bureau of Meteorology) Towards subseasonal predictions of extreme heat Chidong Zhang (University of Miami) Augustin Vintzileos (University of Maryland) Bradfield Lyon (University of Maine, Orno) Chip Konrad (University of North Carolina) |
| Remote Access: | To view the slideshow: 1. Click the link below or copy and paste the link to a browser: https://cpomapp.webex.com/cpomapp/onstage/g.php?MTID=e8c0d26e8b21cf65a49a228ece08edf88 2. Enter your name and e-mail address, and click “Join Now”. If necessary, enter the event passcode: 20910 To hear the audio: Utilize the on-screen dial-in instructions visible after logging into webex Webex and the teleconference line can accommodate only 100 attendees on a first-come, first-served basis. Please try to share a connection with colleagues at your institution to preserve space for others. |
| Watch Webcast: |
(Right click and Save Link As) .mp4 |
ABSTRACTS:
Andrew Marshall – Connecting weather and climate forecasts, especially for extreme events, is highly desirable for meeting societal needs. There has been an increasing demand in Australia for subseasonal forecasts of extremes from various sectors, including health and agriculture. Here we assess the capability of POAMA, the Australian Bureau of Meteorology’s operational subseasonal-seasonal coupled model prediction system, to predict heatwaves and extreme heat over Australia.
The Bureau has a weather forecast heatwave service (http://www.bom.gov.au/australia/heatwave/) that is based on a heatwave index that was developed primarily with human health in mind, although its usefulness extends to other sectors. We have recently extended the heatwave forecast from weather to subseasonal timescales and produced a trial forecast product. This presentation describes the index and demonstrates its application to retrospective and real-time forecasts for providing warnings of the chance of low-intensity, severe and extreme heatwaves occurring over Australia in the upcoming weeks or month. We show that there is significant potential to augment traditional weather forecast warnings for heatwaves to include guidance on longer timescales.
We have also developed a number of other trial products for forecasting extreme heat on the subseasonal timescale. A major component of our research involves assessing the skill of these forecast products, as well as understanding the depiction and prediction of heat extremes in relation to key climate drivers (including the Madden-Julian Oscillation). Understanding the capability of the forecast system for predicting subseasonal extremes underpins the potential future delivery of appropriate forecast products.
Chidong Zhang – Four years after the DYNAMO field campaign, roughly 100 published papers have provided a wide range of results on the MJO events and related variability during the DYNAMO field campaign. In this presentation, selected DYNAMO results that provide new knowledge directly relevant to the advancement of MJO prediction are briefly summarized:
1. Precipitating and non-precipitating shallow clouds are ubiquitous through the life cycle of the MJO but more during suppressed phases when low-mid troposphere is relatively dry. They provide a steady moisture supply to the lower troposphere through vertical transport, and they produce intercepting cold pools to force deeper convection during the transition from convectively inactive to active periods of the MJO. Implication: Shallow convection and its cold pools need to be well represented for MJO prediction.
2. The ocean warm layer is about 4-5 m deep and its diurnal cycle adds ~0.3˚C to daily mean SST and 4 Wm-2 to surface flux. It forces the diurnal cycle of atmospheric convection and related moistening, and thereby helps MJO prediction. Implication: High vertical resolution of the upper ocean is needed to resolve this diurnal warm layer and its effect on the MJO in coupled forecast models.
3. Strong wind-driven shear can persist after surface wind events cease to exist and continue to serve as an energy source for turbulent mixing across the bottom of the mixed layer. This serves as an ocean memory of the MJO. Implication: Wind-driven shear-generated turbulence must be adequately parameterized for accurate forecast of the upper-ocean heat budget associated with the MJO.
4. The radar polarimetric capability allows identification of hydrometeor types within convective systems and their association with mesoscale flows and the evolution of the MJO. Implication: We now are capable of producing 4-dimensional observations of cloud microphysics to help the development of cloud-permitting MJO forecast models.
5. The MJO prediction skill of ECMWF IFS is superior to that of NCEP GFS because IFS better captures synoptic-scale variability at the lead time of 5 – 15 days. The importance of synoptic perturbations is in their role of moisture transport. Implication: Synoptic variability is important to MJO prediction.
Augustin Vintzileos – Resilience to adverse weather and climate conditions can be augmented by using multi-scale prognostic systems. We designed and developed a Subseasonal Excessive Heat Outlook System (SEHOS) to address excessive heat events at lead times beyond Week-1 (subseasonal time scales). The SEHOS consists of (a) a monitoring/verification component that is currently based on reanalyses or Day-1 forecasts and (b) a forecasting component which in its baseline version uses NOAA’s GEFS ensemble 6-hourly predictions of temperature and relative humidity from Day-8 to Day-14. The SEHOS rests on the definition of heat events as the succession of at least two heat days; a heat day is defined as a day with maximum heat index exceeding a certain percentile (typically 90%, 95% and 98%). In this paper we present the SEHOS and discuss verification of forecast lead Week-2 within the GEFS reforecast period (1985-2014). Then, we discuss verification of forecasts when the SEHOS uses predictions from (a) the ECMWF model and (b) the combined ECMWF/GEFS multi-model ensemble. Finally, we present some first results from the extension of the SEHOS to Week-3 and 4 based on the CFS and ECMWF models.
Bradfield Lyon – Summer heat waves have myriad impacts, ranging from deleterious effects on human health to sharp increases in water and energy demand, to stresses on crops. These impacts vary regionally and can display sensitivities to the character of the heat wave and hence, its definition. For example, is the heat wave primarily associated with extreme daily maximum or minimum temperature? What role does heat acclimation and the timing of the heat wave during a given season on the impact? How/does elevated atmospheric humidity also play a role? These questions point to the fact that there is no universal definition of a heat wave. This talk will be based on a larger NOAA-funded project that is examining spatial variations, regional persistence characteristics and trends in US summer heat waves. The emphasis will be on regional variations in heat wave characteristics and their definitional sensitivity. This will include examining different temperature variables, including daily maximum and minimum temperature, apparent temperature and equivalent temperature and their persistence characteristics. The connection of different types of heat waves to the large-scale atmospheric circulation will also be briefly discussed, as will some impacts of extreme temperatures.
Chip Konrad – The HHVT (www.sercc.com/hhvt) is a web-based tool that predicts the daily number of emergency department visits for heat-related illness across North Carolina. The current version of the tool inputs 5-day NWS point forecasts of daily maximum temperatures and employs empirical relationships to translate these values into useful information regarding the probability of emergency department visits due to the heat. It is geared towards public health officials and emergency management personnel across the state of North Carolina. In this talk, I describe the empirical relationships used to generate the predictions, the user interface and graphical output of the model, and features of the second version of the model, which will be based on the daily maximum heat index. I will close with a few ideas on how the model might be incorporated into efforts to predict heat illness over longer time scales.


