A team of researchers from six countries, including Arlyn Andrews from NOAA’s Global Monitoring Laboratory (GML) supported by the CPO Atmospheric Chemistry, Carbon, and Climate (AC4) program, found that anthropogenic emissions for methane from 2010-2017 in the US, Canada, and Mexico are underestimated compared with the trends based on national inventories over the same time period. In particular, emissions from the oil sector can explain most of the underestimation.
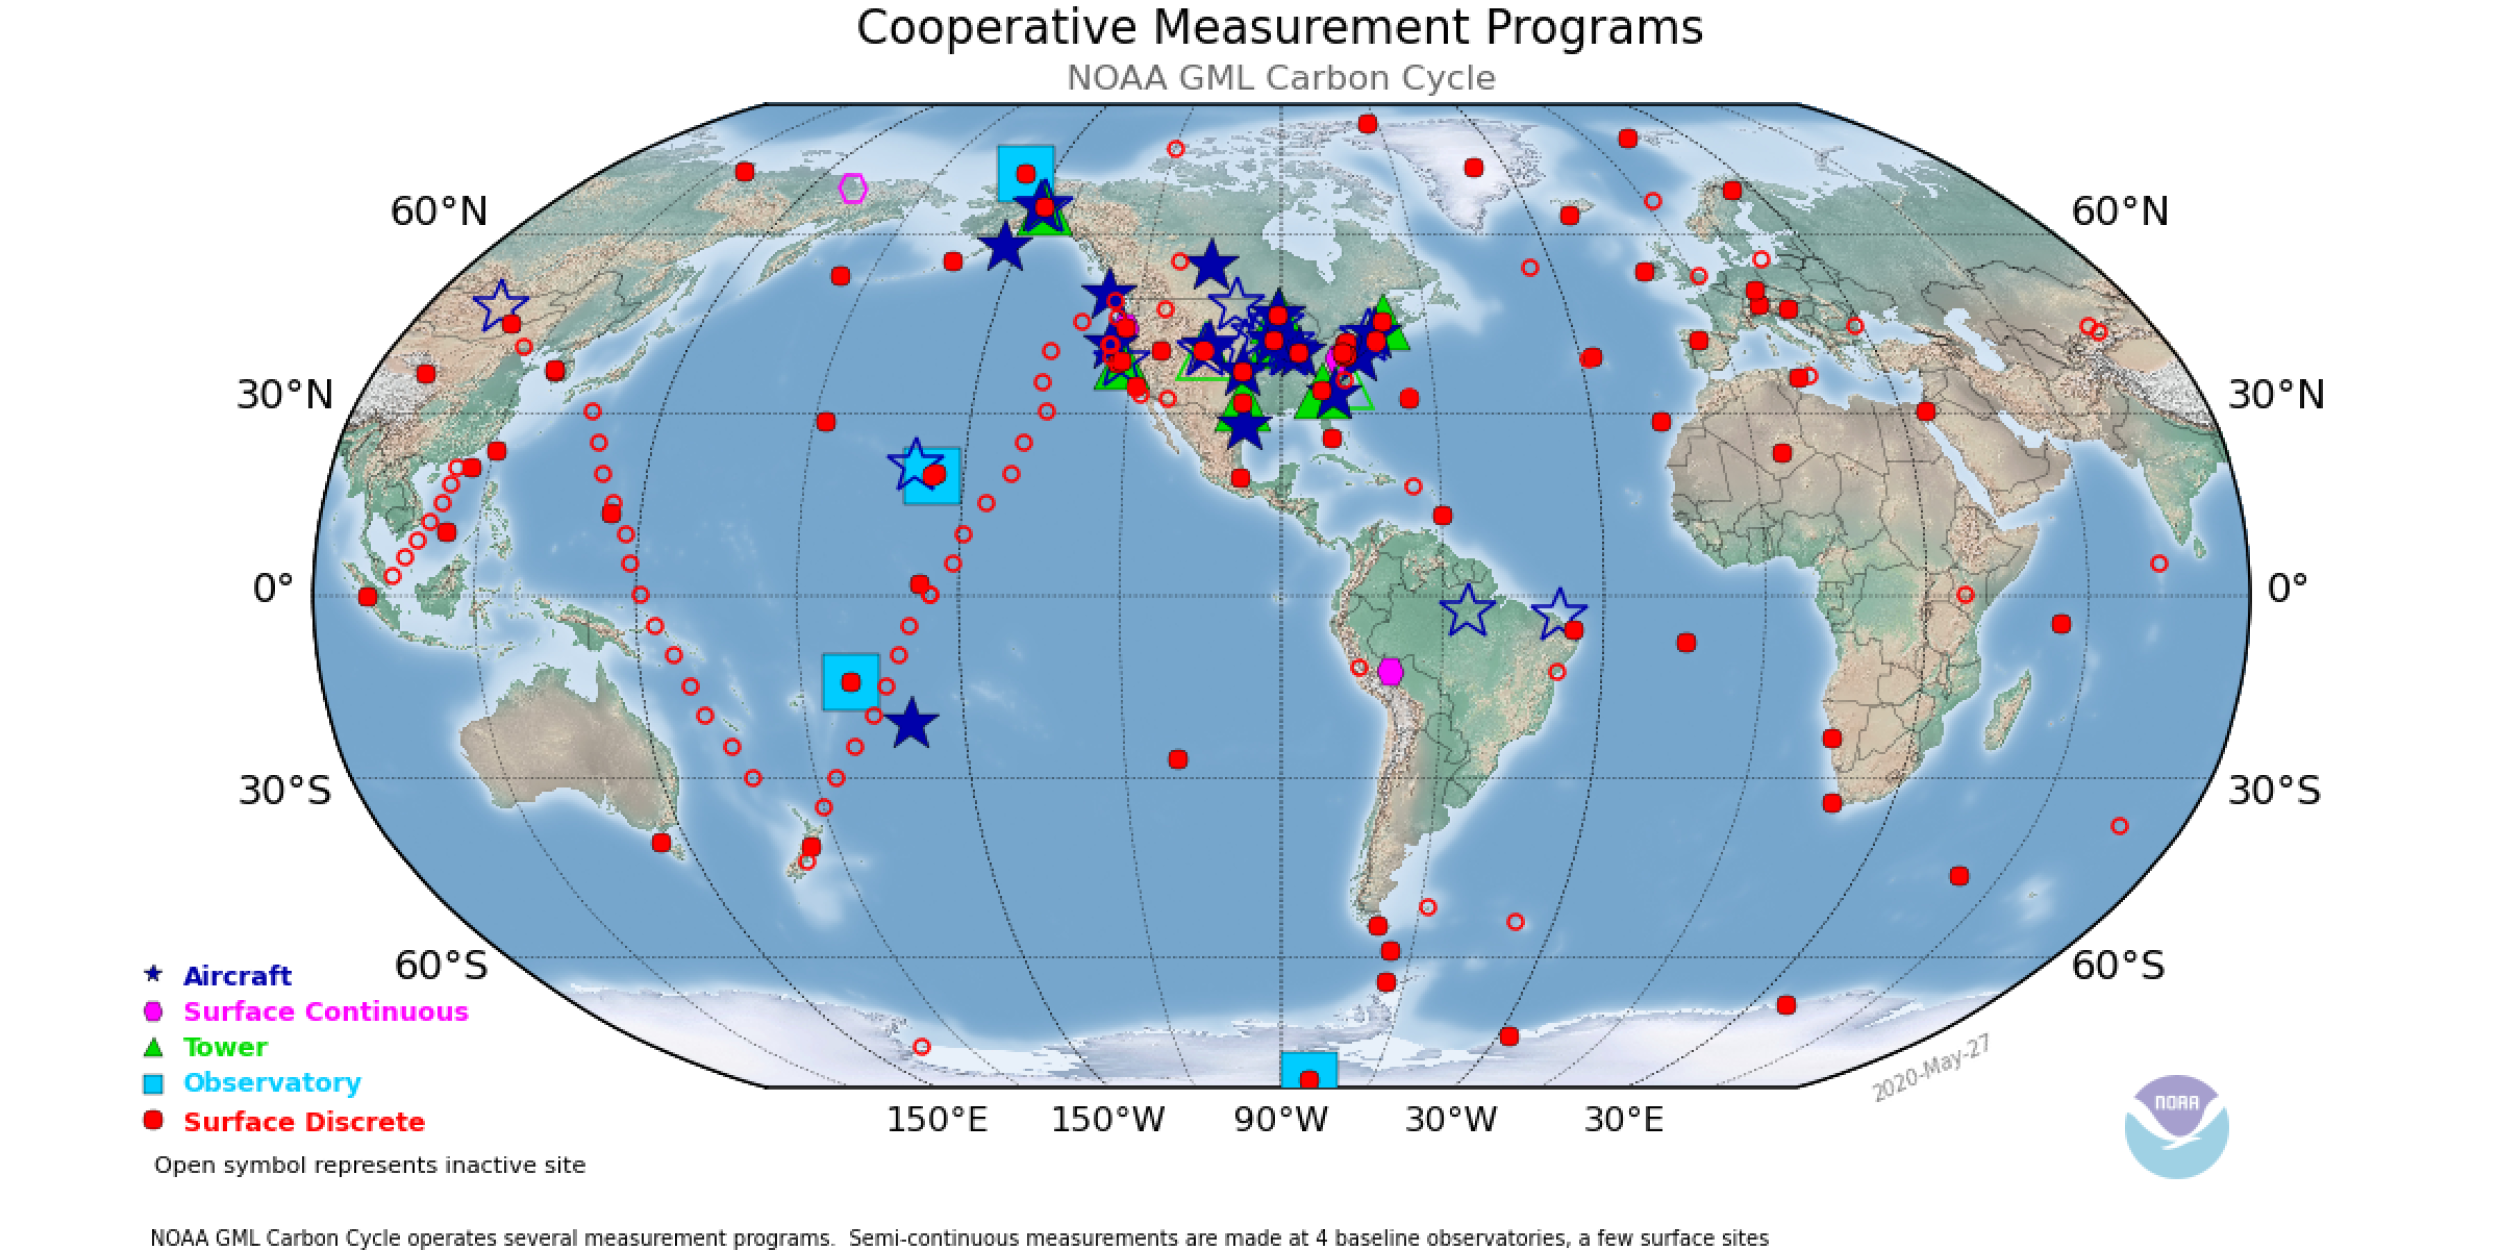
Published in Atmospheric Chemistry and Physics, their work compares 2010-2017 national emissions inventories and their trends with methane emissions developed from extensive in situ observations from surface sites, towers, ships, and aircraft along with Greenhouse Gases Observing Satellite (GOSAT) observations. The NOAA Global Greenhouse Gas Reference Network provided part of the in situ observations and the observation package (GLOBALVIEWplus CH4 ObsPack) were compiled by GML.
Atmospheric methane is the most important greenhouse after carbon dioxide. Natural emissions of methane mainly come from wetlands, while anthropogenic or human-driven emissions come from the oil and gas supply chain, coal mining, livestock, and waste management. According to researchers, the national inventories underestimate methane emissions from the oil sector, particularly in the south-central US, western Canada, and southeastern Mexico.
While the EPA reports a steady decrease in methane emissions over the study period, this research found instead that US emissions peaked in 2014 and then declined as increasing emissions from the oil and landfill sectors are offset by decreasing emissions from the gas sector. Livestock and coal sector emissions showed little change. Canada and Mexico both show decreasing trends mainly driven by oil and gas emissions. Natural methane emissions are also increasing in wetland areas with increased precipitation.
Picture Credit: Global Greenhouse Reference Network, NOAA/GML


