The Fifth National Climate Assessment (NCA5) represents the latest science in assessing changes in the climate, its national and regional impacts, and options to reduce present and future risk. Every five years, the U.S. Global Change Research Program releases a new National Climate Assessment. The newest assessment, NCA5, is a resource to understand how drought will change as the climate changes, how we can adapt, and how future droughts might impact your region and livelihood.
Check out these 10 maps and graphics to learn more about drought in a changing climate.
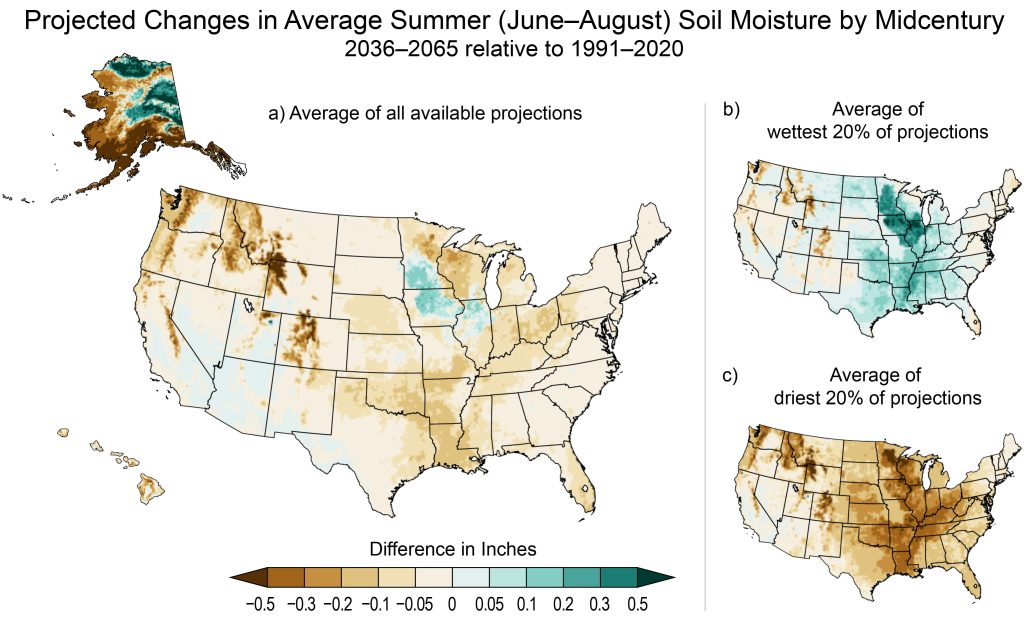
Summer soil moisture will likely decrease
One of the ways we can understand drought is through the water stored in soil, soil moisture. Soil moisture supports agricultural crops and ecosystems and is a factor in how much precipitation and snowmelt becomes runoff in streams and rivers. Across most of the U.S., summer soil moisture is expected to decrease, with the greatest decreases in southern Alaska and the mountain ranges of the Western U.S. Learn more about projected changes in drought in the water chapter.
Check out these 10 maps and graphics to learn more about drought in a changing climate, developed by CPO’s National Integrated Drought Information System (NIDIS).
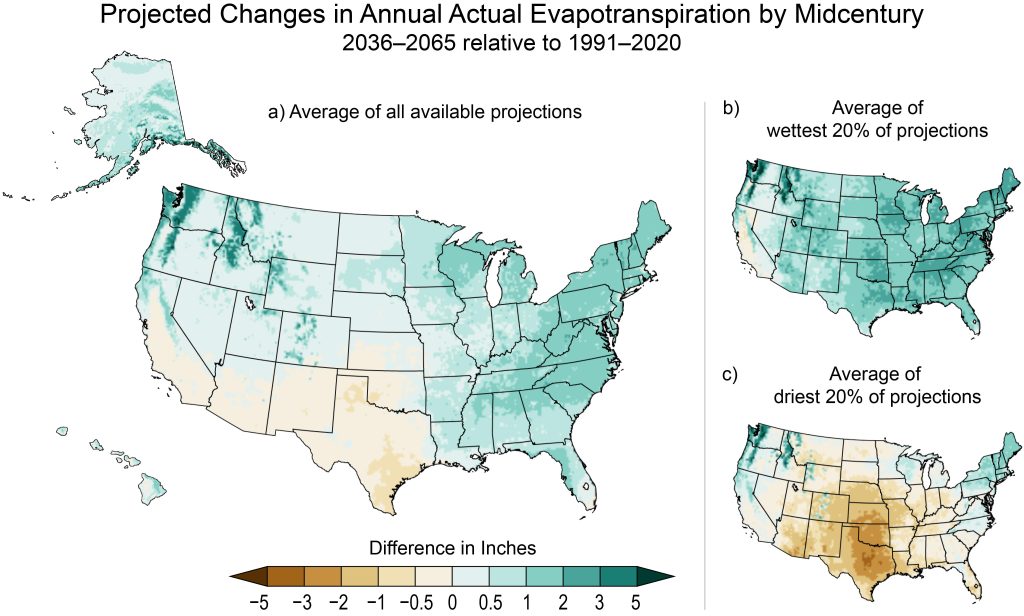
Evapotranspiration will change
For the most part, precipitation has increased in the Eastern U.S. and decreased in the Western U.S. over the 20th–21st centuries. But across nearly the entire nation, average annual temperatures are rising. That warming alters the amount of evapotranspiration, a measure of the water used by plants and evaporating from the earth’s surface into the atmosphere. Actual evapotranspiration represents evaporative demand limited by the amount of water available to evaporate or transpire from plants into the atmosphere. This measure of evapotranspiration has trended lower in the Southwest as water availability has decreased, while it increased in the East and North. These trends are expected to continue under climate change.

Drought will look different across regions
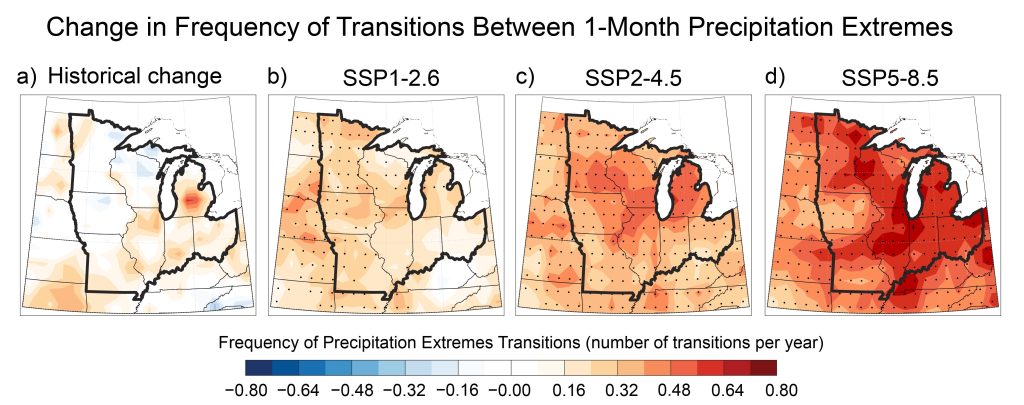
Climate change will cause drought to look different across the U.S. In the Western United States, more snow is expected to fall as rain, and mountain snowpacks are expected to melt earlier in the season, driving snow drought. In areas where snow is the dominant source of runoff, this will stress water supplies. In the Midwest, precipitation is expected to become more variable in winter and spring, making the region more susceptible to flash droughts, the rapid onset or intensification of drought. Along coasts and on islands, drought can drive saltwater intrusion into the water table, reducing the amount of fresh groundwater available. NCA5 includes chapters on the regional impacts of climate change, including changes in drought. Find the chapter for your region.

Drought will have a greater impact on human health
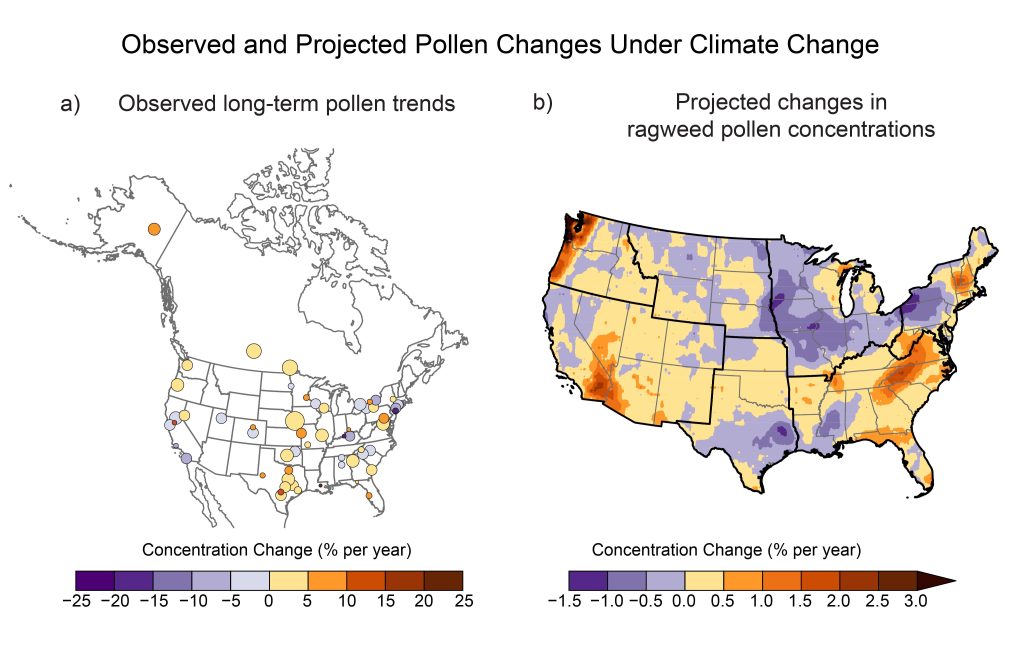
Depending on where you live, your allergies might be getting worse. The amount of pollen in the air has increased and is projected continue to increase in many parts of the U.S. More plant and soil particulates that reduce air quality are expected to enter the atmosphere in warmer and drier conditions. But drought’s impact on human health can be far more serious than a runny nose. Drought is responsible for approximately 99 deaths per year over the last 40 years, measured by deaths associated with U.S. Billion-Dollar Weather and Climate Disasters as of 2022. In 2023, that number increased to 102 deaths per year. That number is likely underreported, as it only accounts for heat-related deaths accompanying droughts.
There are a number of other ways drought can drive mortality. Drought can lead to decreased air quality, resulting in an increase in cardiovascular and pulmonary disease and premature death. It can degrade water quantity and quality, increasing exposure to contaminants such as heavy metals and bacteria. And it is associated with worsening mental health among rural farmers in the U.S.
Learn more about climate change and human health in the air quality and human health chapters.

Drought’s disproportionate impact
While all regions are impacted by drought, some people are more vulnerable to negative impacts of drought due to socioeconomic factors.
For example, climate stressors, including drought, disproportionately impact small-scale, Black, Indigenous, and economically disadvantaged farmers. These groups are more likely to be under-resourced, making adaptation to climate change more difficult. An increase in drought is also expected to drive a northward spread of Valley fever, a respiratory disease, which infects people when they inhale dust that contains the Valley fever fungus. Valley fever tends to afflict construction and agricultural workers, and the disease disproportionately impacts Black and Latinx populations, possibly due to occupational exposure.
Learn more about how climate change impacts Indigenous Peoples and Social Systems and Justice.


More drought, more risk of big fires
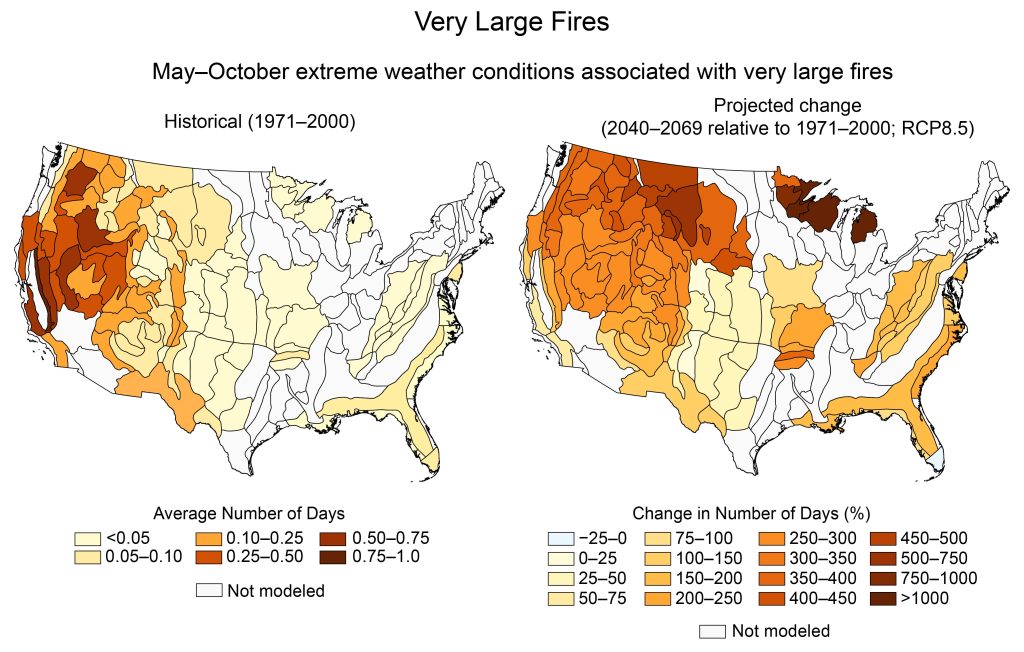
Wildfires are worsening by a number of different metrics in a changing climate. The amount of forest burned in the Western U.S. has increased since the mid- to late-20th century, in part due to higher rates of evapotranspiration and warmer temperatures. Fires are not only burning more land; they are becoming more severe. The area burned by high-severity wildfires has also increased in warmer, drier conditions. Increased fire severity is expected to become more widespread in U.S. forests in the future as extreme weather conditions become more frequent.
Learn more about climate change and wildfire in the forests chapter.

The economic cost of drought
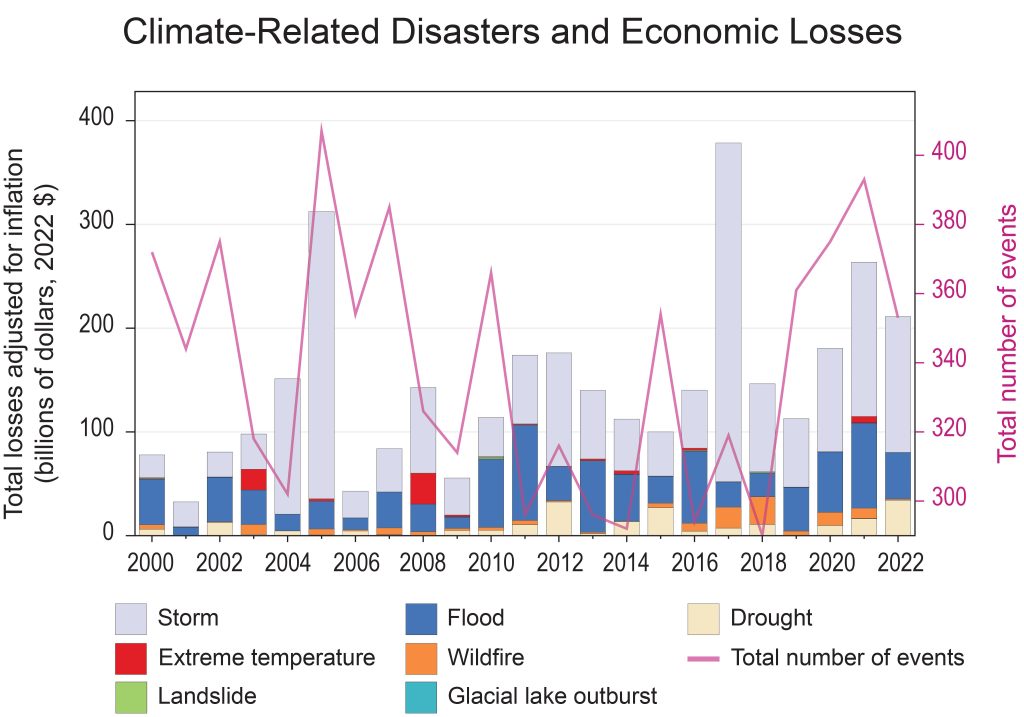
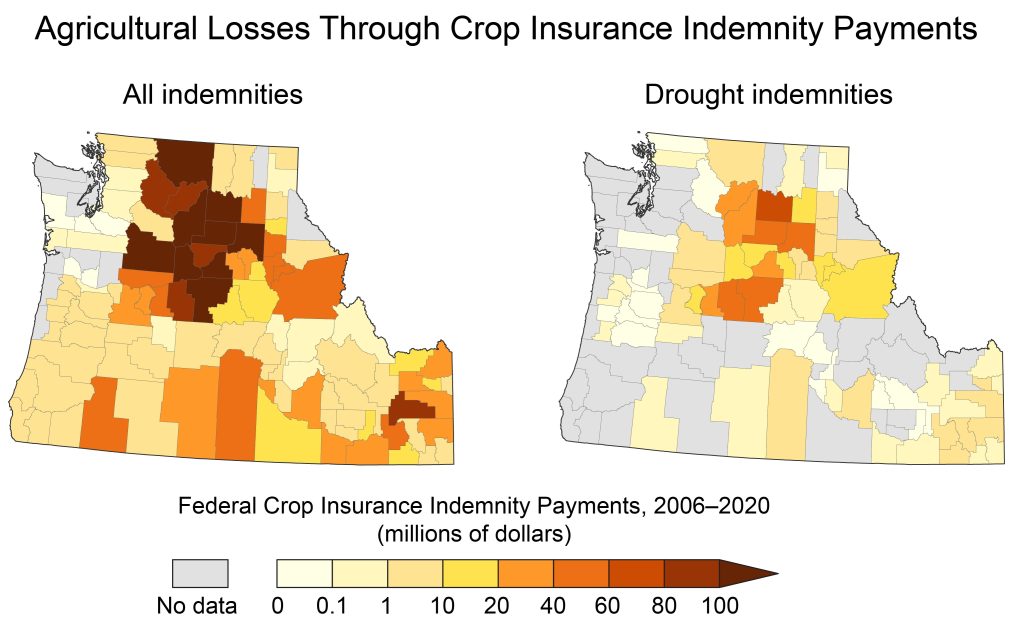
Drought can also impact many sectors of the economy. In times of drought, the agricultural industry faces reduced yields and may see increased costs for healthcare and to maintain soil, crop, and livestock health. This can lead to increased crop insurance loss payments and other federal and state aid. Drought can reduce the amount of water available for hydropower and contribute to degraded energy infrastructure. Wildfire, which can be exacerbated by drought, can damage energy generation systems. Low water levels in rivers can slow down shipping on large rivers, and extreme heat can buckle railways. The outdoor recreation industry can lose revenues as drought negatively impacts ecosystems that support hunting and fishing, reduces water levels for water-based recreation, and limits snowpack. Exposure to climate hazards such as heat, wildfire, and drought can lower a home’s value, which can in turn reduce property tax revenues for governments.
Learn how climate change is impacting ecosystems, transportation, energy, and other sectors in topical chapters.


Drought impacts policy
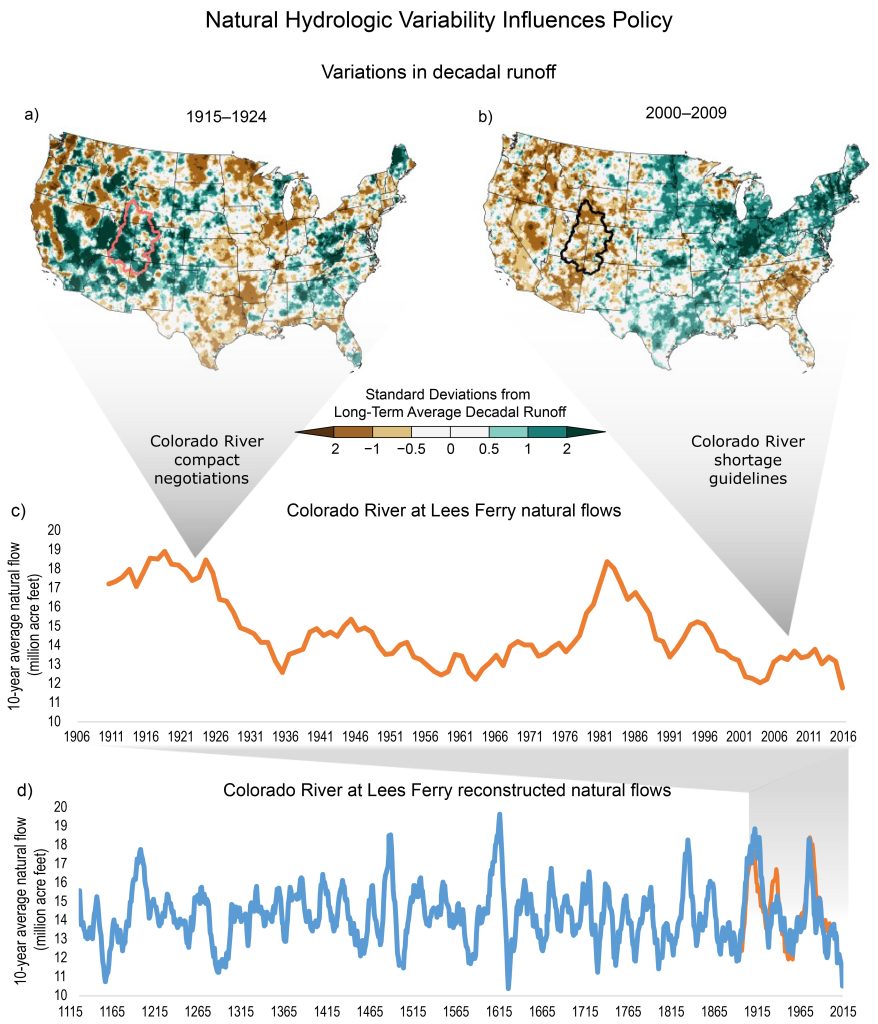
Drought can result in competition, collaboration, or conflict over water. Historically, very wet and very dry years have inspired policy action. After 22 years of drought in the Colorado River basin, water managers created guidelines to restrict water use in times of shortage on the Colorado River in 2007. In contrast, after the wettest period in the past 1,200 years, the 1922 Colorado River Compact divided the river between seven western states, and it allocated more water than the river provided. As climate change continues, the variability of our natural systems is expected to continue as well, creating challenges to plan for and create policies to adapt to climate change.
Learn more about drought and policy under climate change in the water chapter.

It’s not all doom and gloom
A hotter, drier future can be scary to think about, but the NCA5 focuses on what we can do about it. Each chapter highlights adaptation strategies communities are already taking to manage drought, wildfire, and heat. It also describes transformations and adaptations we can implement as we plan for this future.
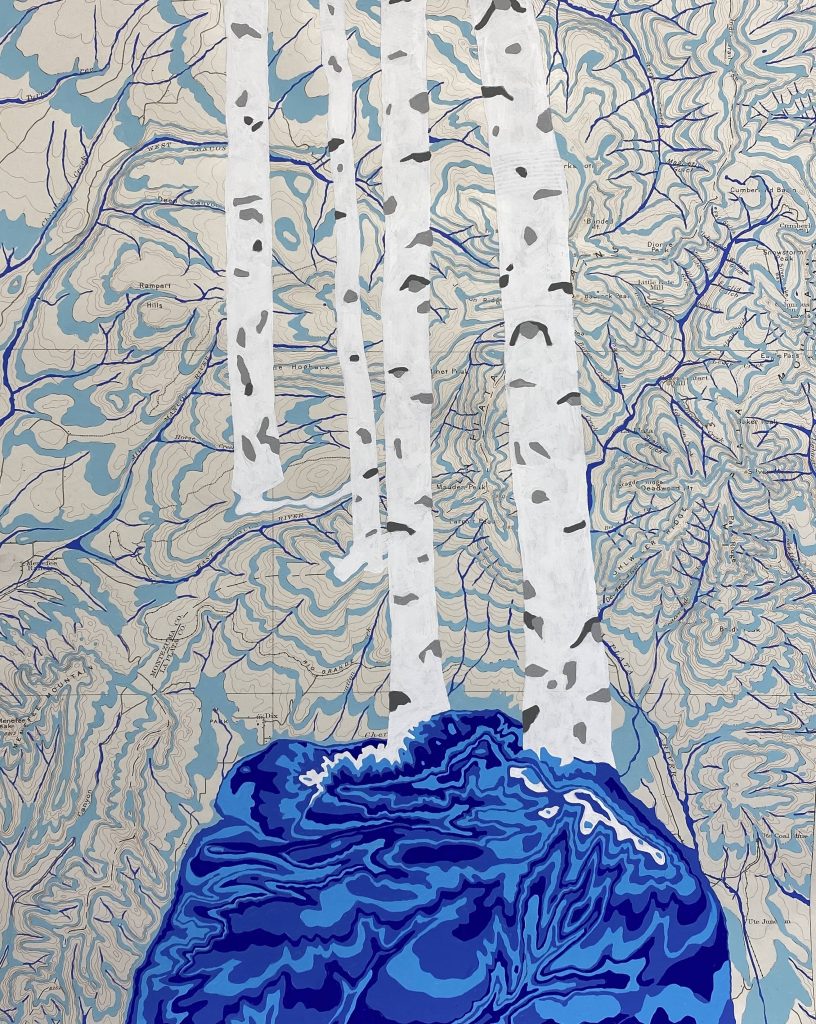
Art can help too; NCA5 showcases a gallery of art inspired by climate change in the U.S. Art X Climate is the first art gallery to be featured in the National Climate Assessment and was created with the understanding that, together, art and science move people to greater understanding and action. View the art gallery.
