Did you miss last month’s learning sessions about tools and information available on the Water Resources Dashboard? We’ve got you covered: see below for recordings and check out our Water Resources Dashboard playlist on YouTube.
The Water Resources Dashboard, a user-driven and dynamic page on the Climate Resilience Toolkit, provides access to maps and data that help water resource managers and urban planners monitor the potential for extreme precipitation and drought in their regions. Several water and planning organizations have contributed to the dashboard, including the American Planning Association, the American Water Works Association, the Association of Metropolitan Water Agencies, the National Oceanic and Atmospheric Administration, Water Environment Federation, Water Environment Research Foundation, and the Environmental Protection Agency. To supplement this joint effort, the Toolkit team held a series of learning sessions to provide scientific and practical, applied information about the datasets on the dashboard. These sessions were initially broadcast using GoToWebinar on November 9, 16, and 20.
—————————-
November 9, 2017 1:00 – 1:30 p.m. ET – Historical Weather Observations
Data Source: https://gis.ncdc.noaa.gov/maps/ncei#app=cdo&cfg=obs&theme=ghcn
Hourly Precipitation, Daily Summary Observations and Daily Normals
NOAA’s National Centers for Environmental Information (NCEI) is responsible for preserving, monitoring, assessing, and providing public access to the Nation’s treasure of climate and historical weather data and information. This session will highlight how to access historical precipitation data and 30-year normals from NCEI’s Climate Data Online Tool.
Speaker: Stuart Hinson
————————-
November 16, 2017 1:00 – 1:30 p.m. ET – National Water Model (NWM)
Data Source: water.noaa.gov/about/nwm
The National Water Model (NWM) is a hydrologic model that simulates observed and forecast streamflow over the entire continental United States (CONUS). The NWM simulates the water cycle with mathematical representations of the different processes and how they fit together. This complex representation of physical processes such as snowmelt and infiltration and movement of water through the soil layers varies significantly with changing elevations, soils, vegetation types and a host of other variables. Additionally, extreme variability in precipitation over short distances and times can cause the response on rivers and streams to change very quickly. Overall, the process is so complex that to simulate it with a mathematical model means that it needs a very high powered computer or super computer in order to run in the time frame needed to support decision makers when flooding is threatened.
The NWM complements current hydrologic modeling which is done in a simplified manner for approximately 4000 locations across the CONUS by providing information at a very fine spatial and temporal scale at those locations, as well as for locations that don’t have a traditional river forecast.
Speaker: Peter Colohan
Peter Colohan is the Director of Service Innovation and Partnership for the Office of Water Prediction at the National Oceanic and Atmospheric Administration (NOAA). From 2010 to 2016, Peter served as a senior advisor to Obama Administration officials on environmental data, climate, water, and drought, first as a member of the White House staff in the Office of Science and Technology Policy (OSTP)s Assistant Director for Environmental Information, then as senior advisor to the NOAA Chief Scientist. From 2002 to 2010, Peter served NOAA as a consultant and program manager in strategic planning and international coordination of Earth observations and environmental monitoring. During this time, he facilitated the establishment of the Group on Earth Observations (GEO), an intergovernmental body involving over 90 governments, five United Nations agencies, and more than 50 international organizations. Peter holds degrees from the College of William and Mary in Virginia and American University’s School of International Service.
———————–
November 20th, 2:30 – 3:00 pm ET – U.S. Risks of Seasonal Climate Extremes Related to ENSO
Data Source: https://www.esrl.noaa.gov/psd/enso/climaterisks/
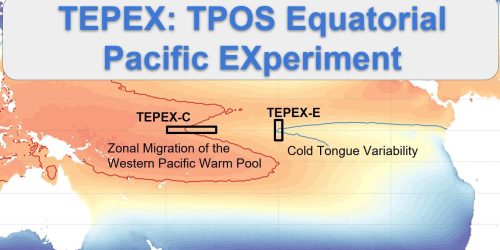
Extremes of temperature and precipitation can occur at any time. However, it can be shown that the El Niño/Southern Oscillation has a relationship to the relative frequency of these seasonal climate extremes in the United States. This website shows which regions of the U.S. have an increased or decreased risk of extreme warm/cold (or dry/wet) seasons during an ENSO event. Note that these changes in ENSO-related climate risk vary not only by region, but also by season.
Speakers: Klaus Wolter and Taryn Finnessey
Klaus Wolter works at Cooperative Institute for Research in Environmental Sciences at Colorado University in Boulder, specifically for NOAA’s Earth System Research Laboratory – Physical Sciences Division. His Ph.D. is from the Department of Meteorology at University of Wisconsin.
Klaus’ original research interests lie in empirical climate research, in particular the application of statistical methods to climate problems, such as the impact of ENSO (El Niño/Southern Oscillation) on world-wide climate. He is the creator of the “Multivariate ENSO Index” (MEI) that is based on tropical Pacific observations of sea level pressure, near-surface wind fields, sea – and air surface temperatures, as well as total cloudiness. The MEI was used to derive ENSO Climate Risk information that will be discussed in brief on the webinar. He is also involved in the NOAA-ESRL PSD Attribution and Predictability Assessment Team that investigates the underlying causes and predictability of climate-related extreme events. He has co-authored an assessment of extreme rainfall events in recent years, including the flooding rains of Colorado in September 2013, the cold Midwestern winter of 2013-14, the record-breaking January 2016 Mid-Atlantic snowstorm “Jonas”, and the surprising lack of rain in California during the 2015-16 El Niño. In 2013 he won the Governor’s Award for High Impact Research and in 2014, the Royal Meteorological Society’s International Journal of Climatology Prize.
Taryn Finnessey works on Climate Change and natural hazard risk management for the State of Colorado. She is responsible for the implementation of HB 13-1293 and coordinates Colorado’s climate change efforts, including aspects of Governor Hickenlooper’s recent Executive Order on climate. She also manages the Colorado State Drought Mitigation and Response plan. She has overseen the development of approaches for quantifying and considering uncertainties and vulnerability in water resource planning & management, and has authored numerous papers and reports. She holds a B.A. in Earth and Environmental Science from Wesleyan University, and a M.A. in Global Environmental Policy from American University.
——————–
For more information, please contact Nancy Beller-Simms at nancy.beller-simms@noaa.gov.


